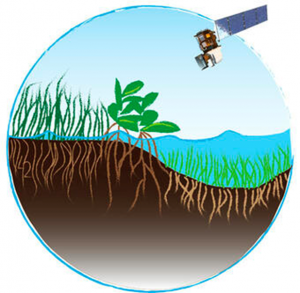
Need-of-the-hour is to quantify mangrove carbon using high-resolution satellite images with machine learning techniques.
Blue carbon ecosystem is significantly important for climate change and mitigation. A recent study shows that 1.23pg of carbon is in the mangrove biomass. So, information on the carbon is required for carbon credit schemes that pay as an incentive for conservation as per the Paris climate agreement (Pham et al., 2019).
For decades, the Above Ground Biomass (AGB) has been quantified by field-based surveys in the mangrove forest, and allometric equations from in situ measurements. The approach is plot-based small scale study, also time consuming and labour intensive and can also be influenced by site bias. Remote Sensing techniques are very popular and effective in estimating the AGB in large scales, also allowing repeatable monitoring of the inaccessible mangrove forests.
The MRV (monitoring, reporting, and verification) system is commonly followed based on a combination of remote-sensing data and forest inventories to analyse carbon stock in forests and ecosystems in general, and trace changes in carbon stock (Böttcher et al., 2009)
Majority of global mangrove remote-sensing studies relating to carbon storage use multispectral imageries acquired by Landsat, SPOT ASTER, or IRS (1C or 1D) programmes. Supervised classification techniques such as the maximum likelihood classification or a hybrid unsupervised/supervised classification scheme techniques are primarily used to detect and delineate mangrove in these imageries. Other common approaches include principal components analysis or spectral vegetation indices such as Normalized Difference Vegetation Index (NDVI).

(Image Source: Public Domain)
The multispectral remote-sensing is limited in terms of spatial resolution or spectral resolution, or the inability of optical sensors to penetrate cloud cover. Newer types of imagery such as very high-resolution imagery (VHR) optical and radar address these limitations. They are used to map mangrove-extent accurately, and also exclusively for mapping individual species and characterising canopy structure, crown area as well as height.
Machine learning models based on remotely sensed data are at present employed to estimate forest biomass and carbon stock. Many statistical models and algorithms that can use remote-sensing data are available now. Out of which, machine learning algorithms have shown effectiveness (Heumann, 2011) (Wang et al., 2017). Machine learning uses the field measurements to train a classification algorithm through iterative repeated data analysis in order to develop an optimal rule set defining an apt combination of satellite observations. These are useful to estimate biomass and carbon, as well as generate of large-scale maps. Once the rules are optimised for training data, they are applied for the entire satellite image. This approach results in continuous values for biomass, based on easily understandable rules that can be adapted and used for a monitoring framework.
Remote sensing-based machine learning modelling approach has not been attempted thus far to estimate the mangrove biomass and carbon stock in Indian mangroves, though a number of studies have used remote-sensing data to detect changes in mangrove forest cover. As the wetlands are important at global and regional level, their quantitative, biophysical information is required, including data on changes in biomass, LAI, percentage of canopy closure, etc. (Running et al., 2004).
Most of the studies use remote sensing data for reporting the above ground biomass and thus, it is commonly used at national, regional and global scales. A study has been carried out in Pichavaram Reserve Forest that has enormous carbon storage capacity to mitigate climate change impacts. The high resolution optical and SAR images are effectively modelled by the machine learning approach and algorithms with field measurements, to estimate the AGB of the mangroves by MSSRF in collaboration with Indian Space Research Organisation (ISRO).
To conclude, need-of-the-hour is to quantify mangrove carbon for the REDD+ UNFCC carbon credit programmes, and for India’s Nationally Determined Contributions (NDCs) under the Paris Agreement using the high-resolution satellite images with machine learning techniques.
Reference
- Böttcher, H., Eisbrenner, K., Fritz, S., Kindermann, G., Kraxner, F., McCallum, I., Obersteiner, M., 2009. An assessment of monitoring requirements and costs of “Reduced Emissions from Deforestation and Degradation.” Carbon Balance Manag. 4, 7. https://doi.org/10.1186/1750-0680-4-7
- Heumann, B.W., 2011. An object-based classification of mangroves using a hybrid decision tree-support vector machine approach. Remote Sens. 3, 2440–2460. https://doi.org/10.3390/rs3112440
- Pham, T.D., Yokoya, N., Bui, D.T., Yoshino, K., Friess, D.A., 2019. Remote sensing approaches for monitoring mangrove species, structure, and biomass: Opportunities and challenges. Remote Sens. https://doi.org/10.3390/rs11030230
- Running, S.W., Nemani, R.R., Heinsch, F.A., Zhao, M., Reeves, M., Hashimoto, H., 2004. A continuous satellite-derived measure of global terrestrial primary production. Bioscience 54, 547–560. https://doi.org/10.1641/0006-3568(2004)054[0547:ACSMOG]2.0.CO;2
- Wang, M., Madden, M., Hendy, I., Estradivari, Ahmadia, G.N., 2017. Modeling projected changes of mangrove biomass in different climatic scenarios in the Sunda Banda Seascapes. Int. J. Digit. Earth 10, 457–468. https://doi.org/10.1080/17538947.2016.1190411

